Cannot log in in the toolbox

Context: toolbox 3.0.0.59313, Windows 2016 server, default browser: Chrome
Issue: I cannot log in - it doesn't work.
The toolbox popup shows this at the bottom.

I clicked on log in, I was redirected to Chrome, to the JB login page, I logged in to my account, then nothing seems to happen. I opened the chrome developer tools and I see a message: Launched external handler for ‘ jetbrains://toolbox/jba/auth?code= … ’
I copied this url and pasted it in the Chrome address bar, I pressed enter, and Chrome opens this dialog:
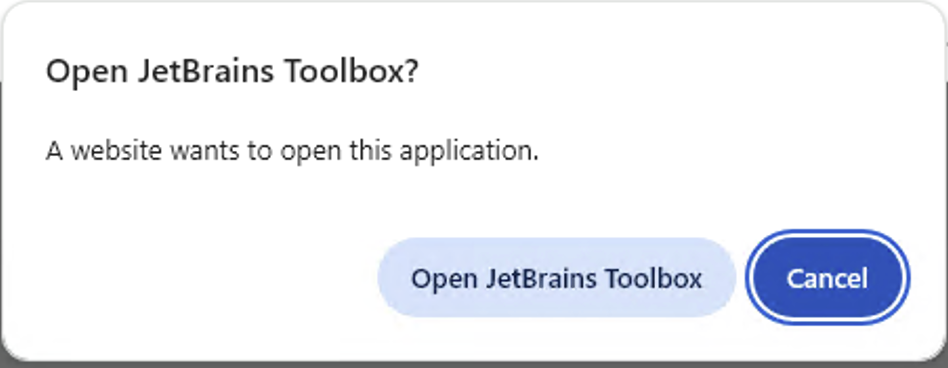
I clicked the Open… button and nothing happens. It didn't log me in.
Any ideas of what happens?
Thanks
Please sign in to leave a comment.
I encounter this error this morning when Chrome is my default browser. After that, I switch my default browser from Chrome Firefox, but the same issue is still there. I am using MacOS 26.
I hit the same issue on Linux using both Firefox and Chrome.
Hey, does it still happen in the latest Toolbox version?
Yes, I am facing exactly the same issue now with JetBrains Toolbox 3.4.1.78303, Windows 10, x64 and Chrome as default browser.
And the reason is that the daemon crashes with the following message:
2026-03-27 22:10:45.688 ERROR daemon - Failed to run the server
java.nio.file.InvalidPathException: Illegal char <"> at index 0: "C:\Users\ <my name here>\AppData\Local\JetBrains\Daemon\bundles\current\jetbrainsd\bin\jetbrainsd.exe" handleUri
What is the supposed workaround?
Removing quotes around the path to the daemon executable in the Windows registry under “Computer\HKEY_CLASSES_ROOT\jetbrains\shell\open\command” helped. But I suggest that Jetbrains should fix it in the code. This is obviously a bug.
I've created an issue about this problem:
https://youtrack.jetbrains.com/issue/TBX-18386
Please attach the full logs to it (Toolbox | Nut icon | About | Collect logs and diagnostic data). This will help us determine whether this has the same root cause as related issues or is a separate case.
Thank you!